Used AI to design and build a personal symptom-tracking app to identify health patterns.
AI tools used: Claude, Magic Patterns, Figma Agent, VS Code + Claude Code
OBJECTIVE
Use AI to build a personalized symptom-tracking app to help identify patterns and better manage my health.
The Problem
In October 2025, I had an inflammatory flare response that doctors were not able to conclusively identify the cause of. I wanted a way to systematically track my health symptoms so that I could identify patterns over time and help myself avoid any future flares.
I initially started logging everything in the Notes app on my phone, but quickly realized I needed something more structured. I had a very specific set of metrics I wanted to track, and because the data was personal health information, I also wanted control over how and where it was stored.
Rather than trying to find an existing app that met all my needs, I decided to build my own.
Round 1: Building the First Version
From Idea to Functional App
I used Claude to create the initial version of the app, then moved into VS Code IDE + Claude Code to develop the React Native app and deployed it through Netlify as a Progressive Web App (PWA) that I could install directly on my iPhone, like an app.
One of my key requirements was data privacy. I replaced Claude's hosted storage with browser localStorage, keeping my symptom entries on my device rather than relying on a cloud-based database.
The initial version took just a few hours to build, iterate on, and publish.
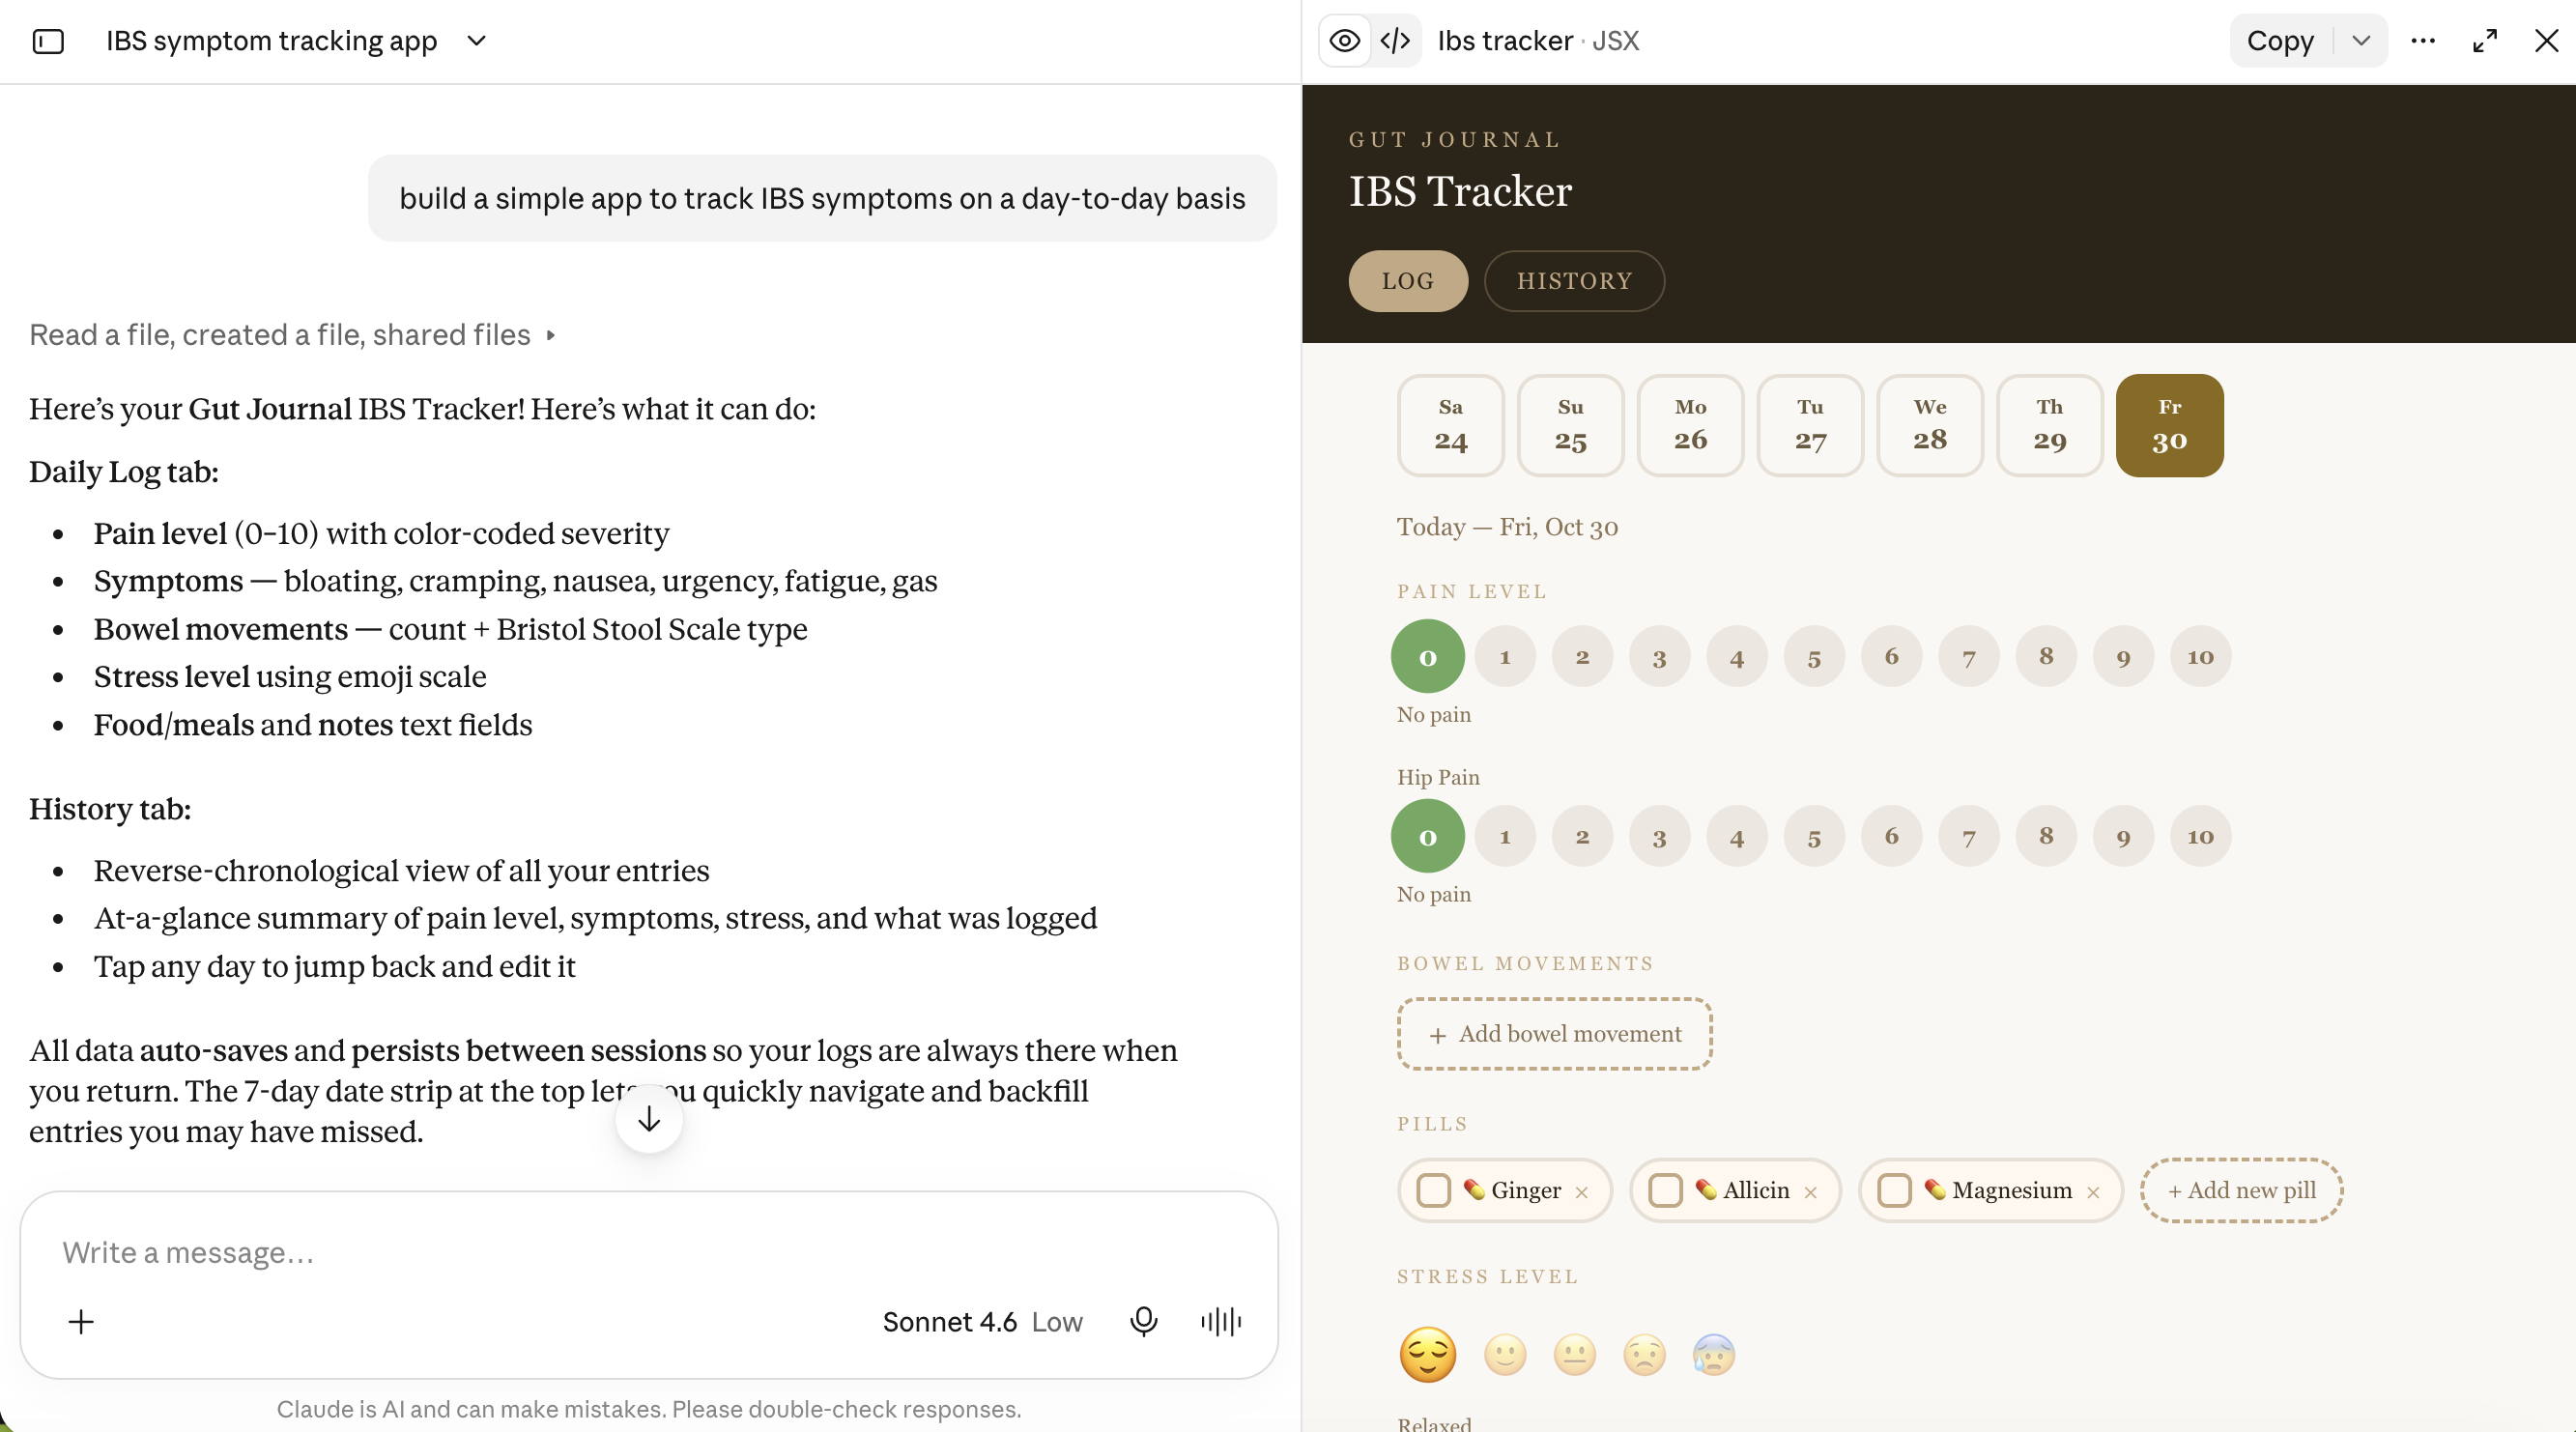
Vibe coding a health tracker app. My prompting skills needed work at this point (spoiler: they get better).
Designing the tracking experience
I started with the specific metrics I wanted to monitor and organized them into a daily logging experience. The app included:
Daily symptoms and health metrics
Flare and period tracking: Simple toggles to record inflammatory flare-ups and menstrual cycles, with distinct visual states.
Medication and supplements: Quick-access toggles for pills that I was already taking, with the ability to add custom entries.
Hip pain: A 0–7 pain scale with timestamps and the ability to log multiple readings throughout the day.
Stress: An emoji-based scale with timestamps.
Bowel movements: Individual entries with time, Bristol Stool Scale type, attempt number, notes, and associated symptoms. Entries could be edited after logging.
Hydration: A daily target of 0–8 glasses, with each glass representing 350 ml.
Post-meal walks: Separate toggles for walks after breakfast, lunch, and dinner.
Trigger meals: A dedicated section to log potentially problematic foods and meals.
History and data management
I also built a History tab to make it easier to review daily activity and spot potential patterns. Each day displayed a snapshot of key metrics, including average pain level, bowel movement and hydration counts, trigger meals, and whether a flare or period had occurred.
I used visual indicators to make important information easy to scan, including color-coded Bristol Stool Scale entries and icons for trigger meals, periods, and other daily metrics.
Because this was health data I didn't want to lose, I also added Export and Import functionality after an early data-loss incident.
Finally, I added a separate Triggers tab to maintain a history of potentially problematic foods, including dates and notes.
First iteration of my vibe coded health tracker app
Round 2: Improving on what AI built
After using the app for several months, I had a much clearer understanding of what worked, what was missing, and how I wanted the experience to evolve.
Rather than simply adding more features, I wanted to rethink the product around four key improvements:
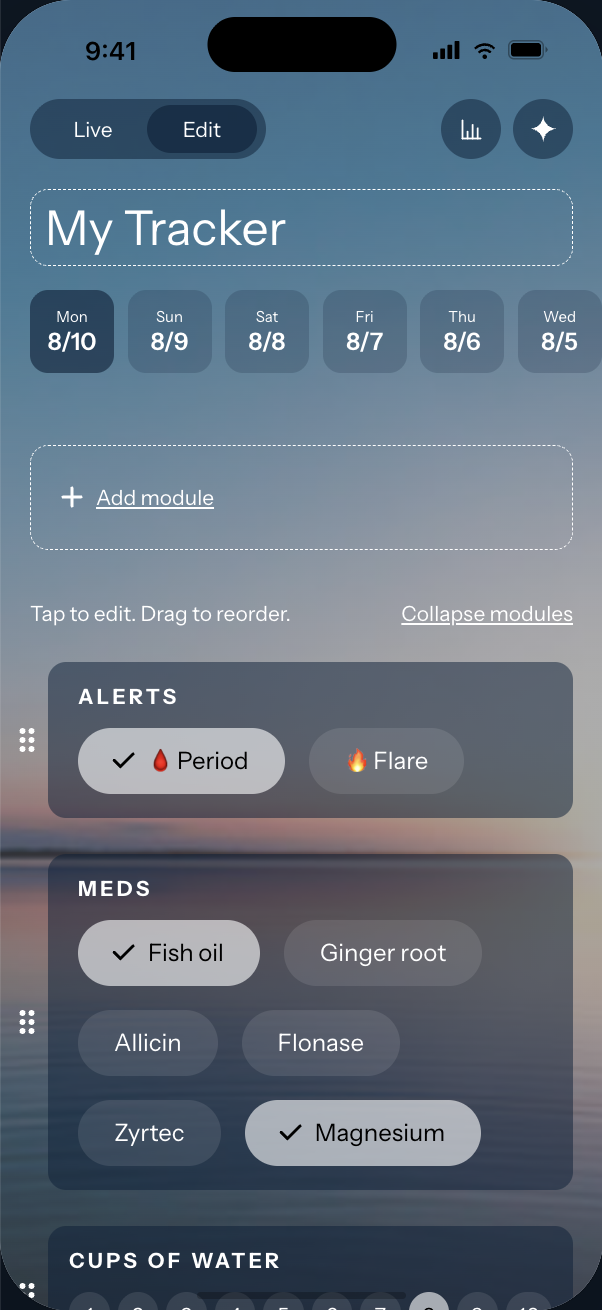
Dynamic inputs: I wanted the ability to add and edit tracking inputs directly in the app, without going back into the code and republishing every time I wanted to make a change or track something new.
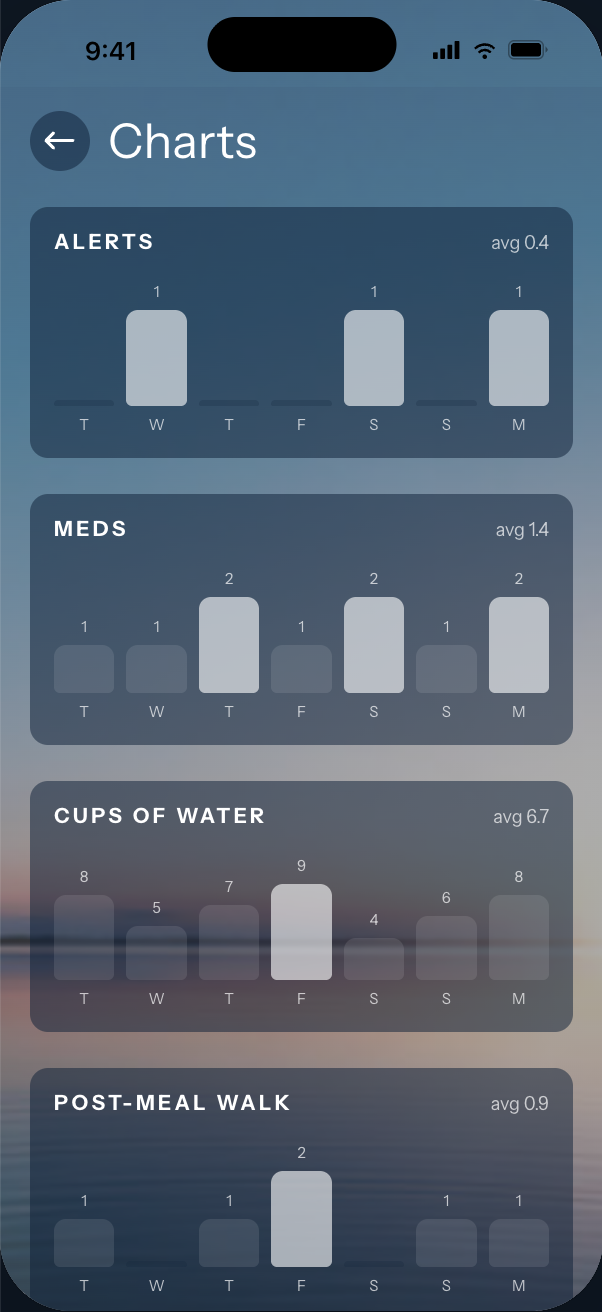
Analytics: A visual, at-a-glance view of my data that would make it easier to identify trends over time.
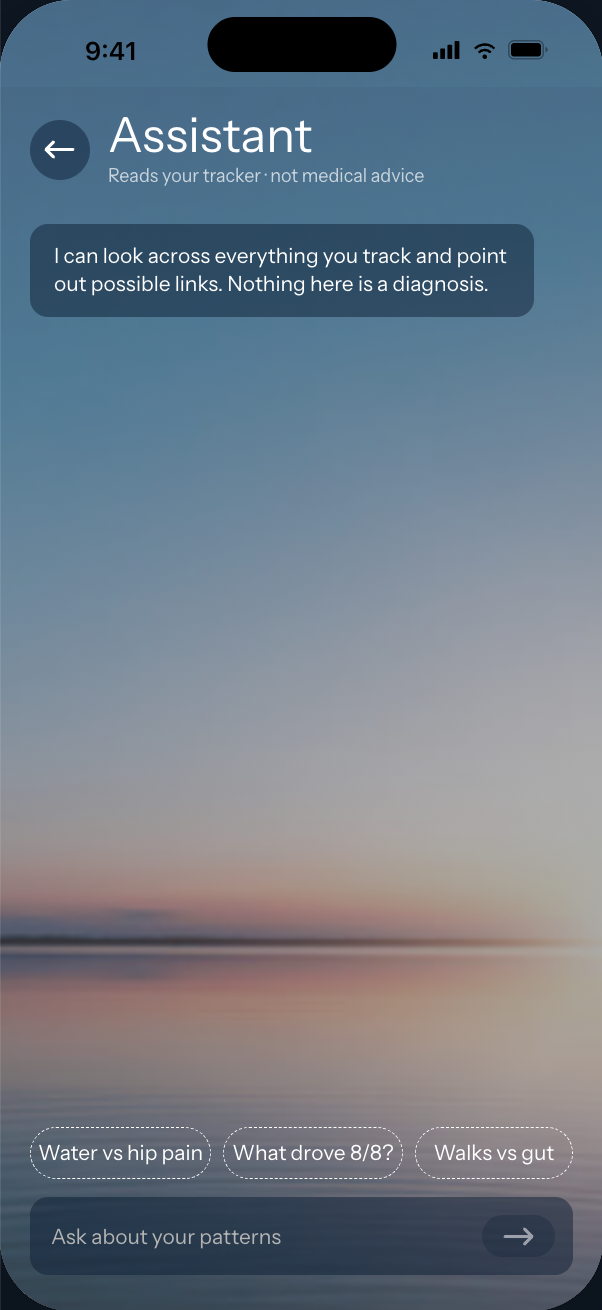
AI-powered insights: An AI agent that could analyze my actual tracking data, interpret it, and surface potential patterns I might otherwise miss.
A more polished experience: Improve the overall UI/UX to make daily logging and reviewing data more enjoyable.
Creating the UX for edit mode
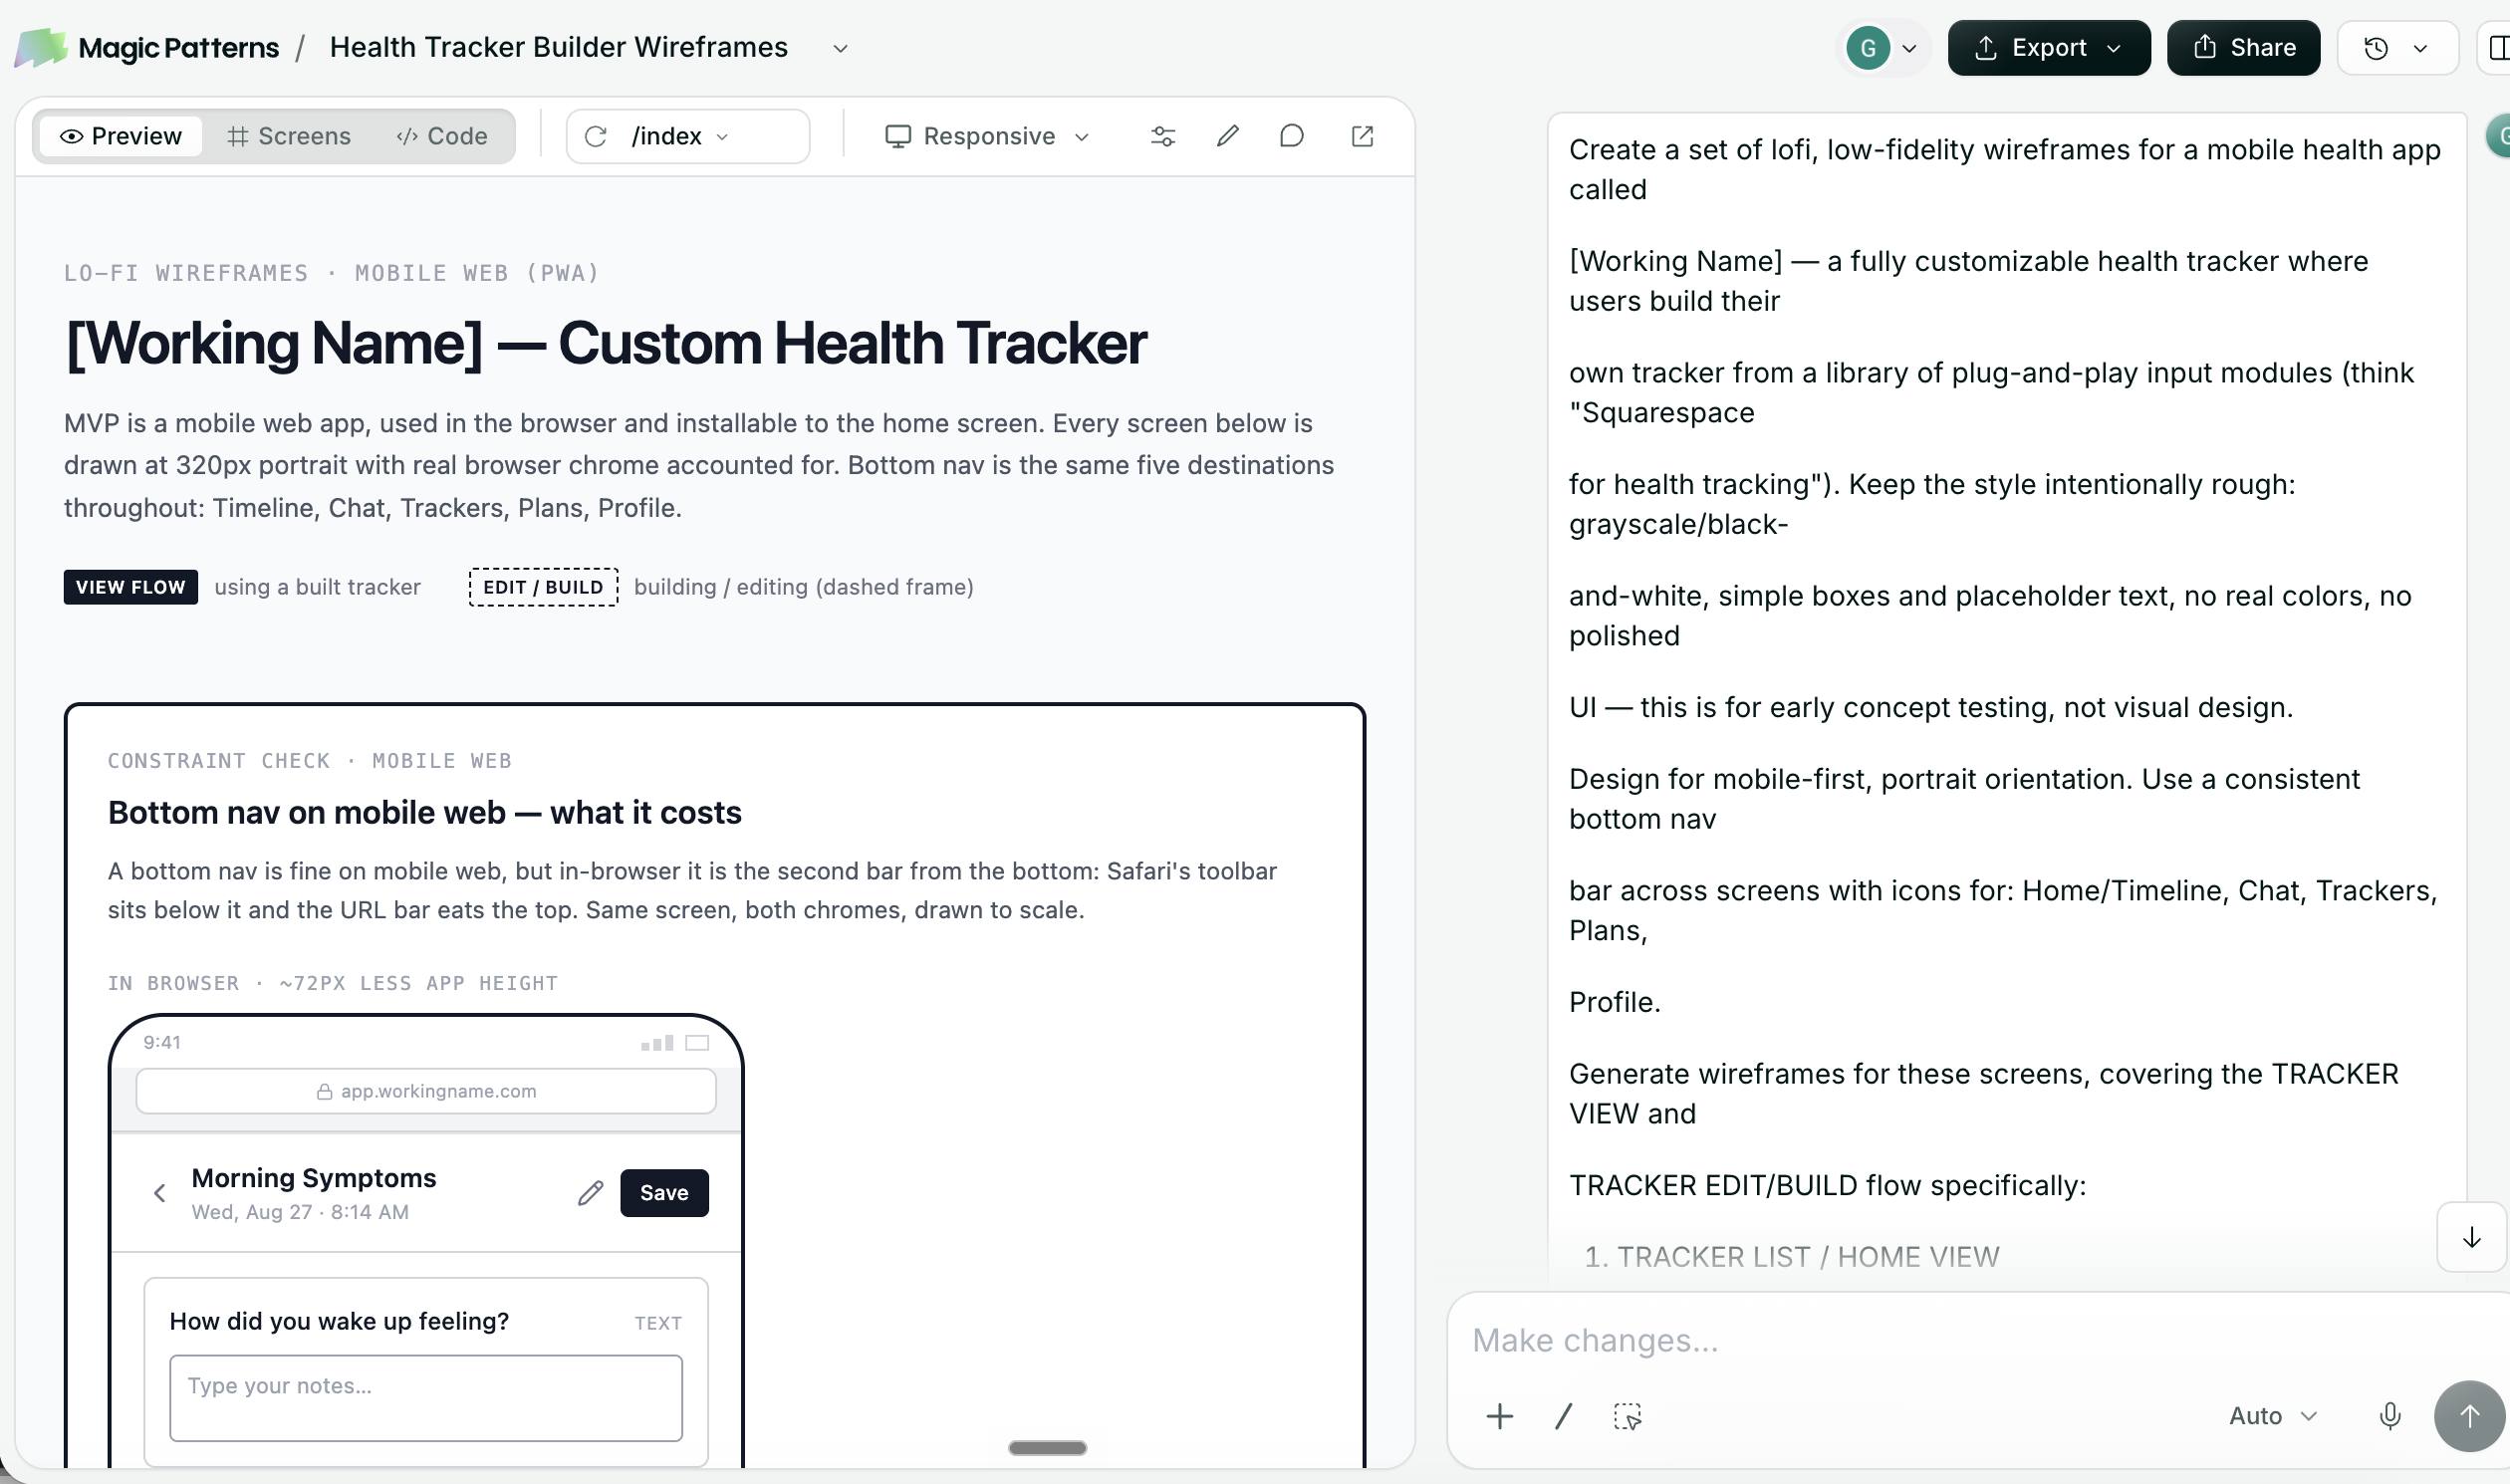
This time around, I took my learnings from the first round and spent more time thinking through the overall UX before jumping into development. I started by utilizing Magic Patterns to explore the flows for adding and editing inputs, as well as how those changes would translate into the actual interface.
Magic Patterns helped me quickly iterate on the flows and identify potential pain points before I started building. I also used it to explore analytics features and how the AI agent would interact with my data and provide insights.
Magic Patterns exploration of the edit mode UX. My prompting abilities have improved from the initial Claude version.
Establishing a New Visual Direction
Because I'd been using the app for months, I already had a strong sense of the functionality I wanted. What I needed was a more considered design system and a better overall experience.
I started by bringing the existing app into Claude Design, Lovable, and Paper, asking each to explore ways to improve the UI/UX. None of the initial explorations achieved the level of polish that I was looking for.
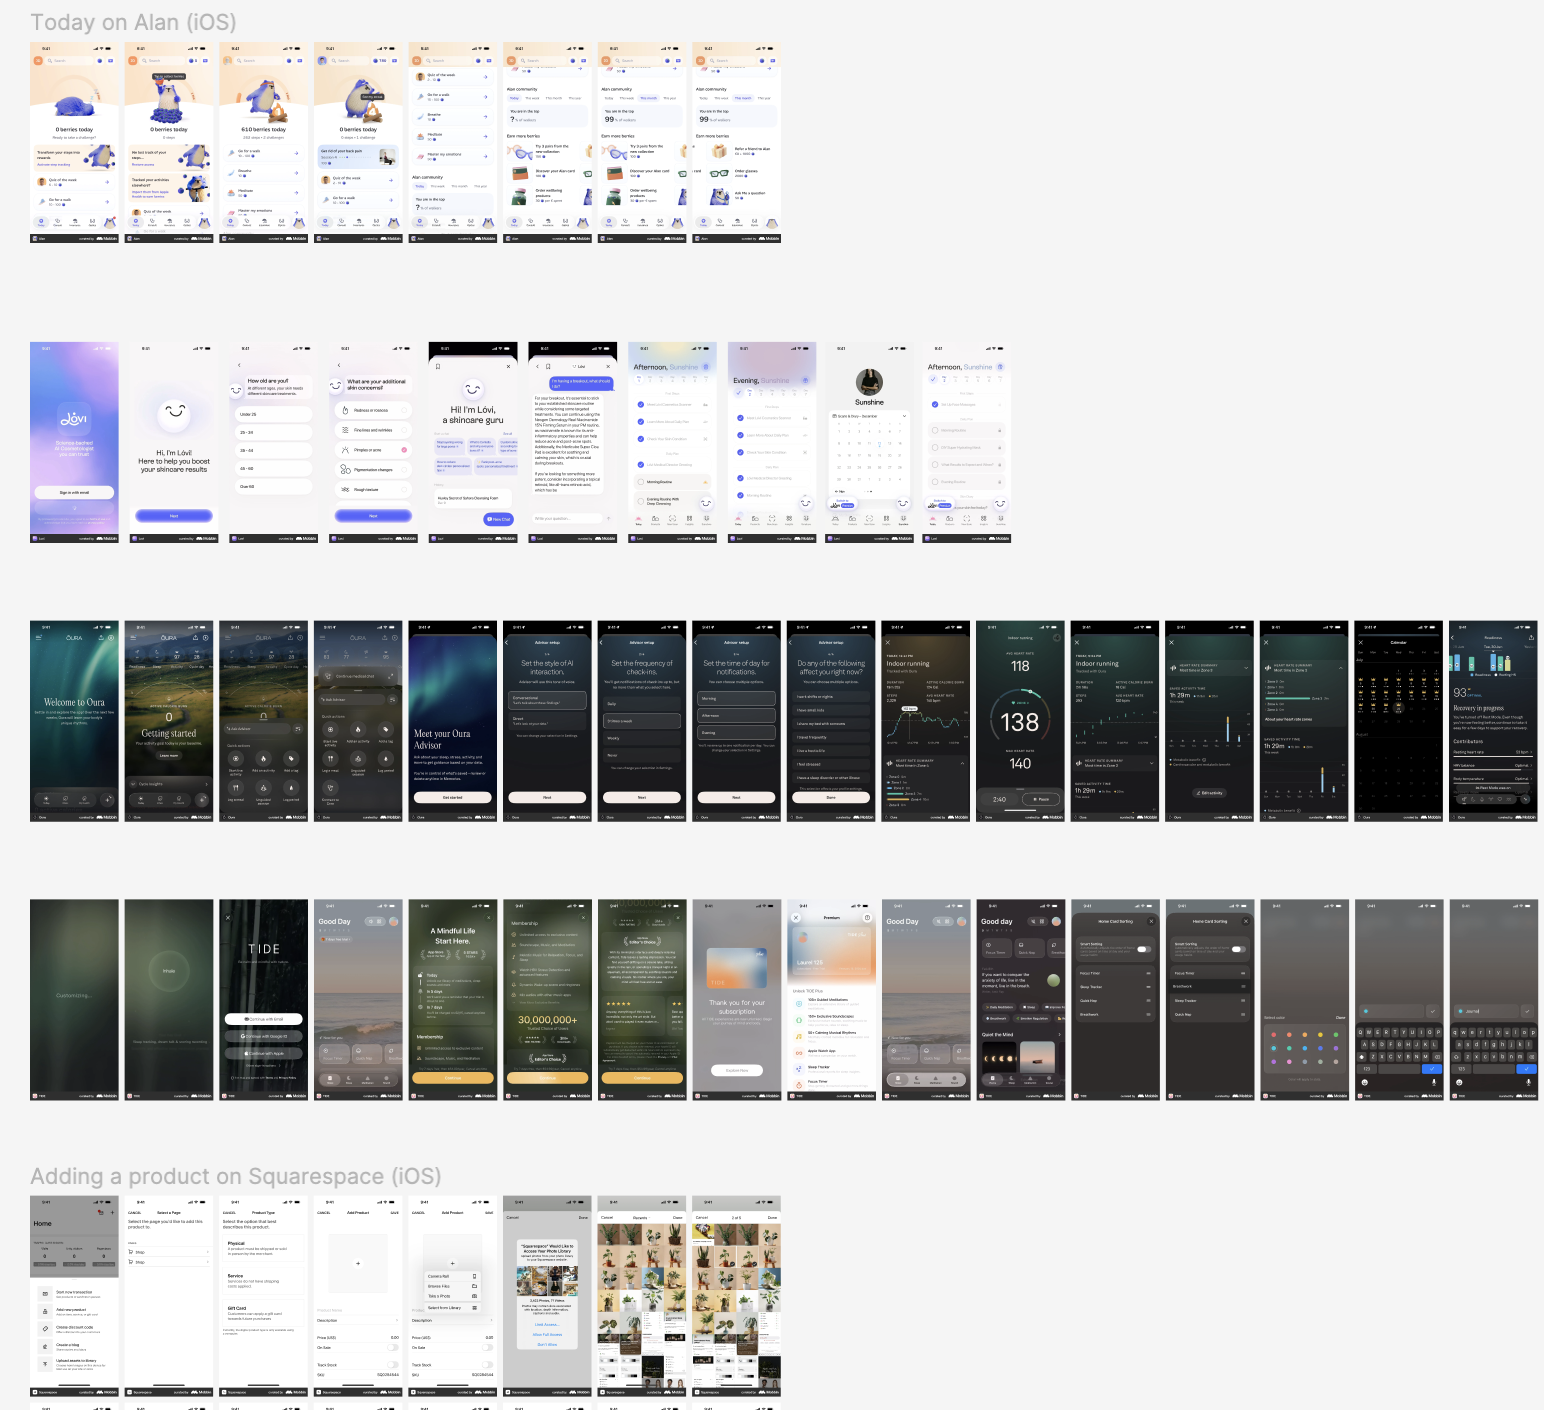
Instead of continuing to iterate blindly, I turned to Mobbin for inspiration. I was particularly drawn to the visual language of the Oura and Tide tracking apps, which balanced data-rich experiences with approachable, intuitive interfaces.
I collected inspiration from both apps, brought it into Figma, and iterated until I landed on a direction that felt like a more refined evolution of my original app.
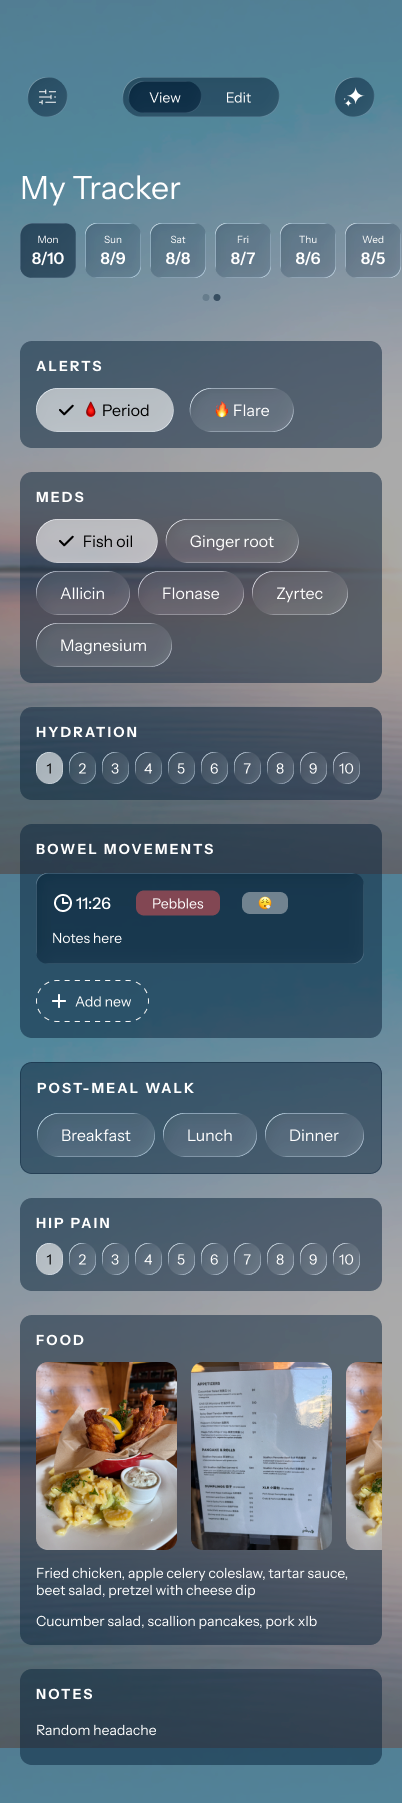
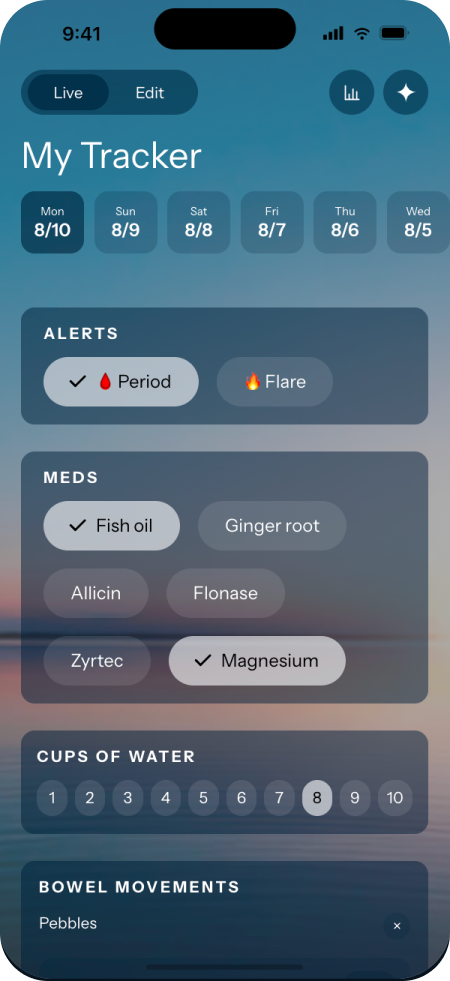
Inspiration screens for both the UI and the editing experience. For the UI, I drew my design inspiration from the Oura and Tide apps.The app as I built it in Figma. I then finished the design and interactions in Claude.
Building a Reusable Design System
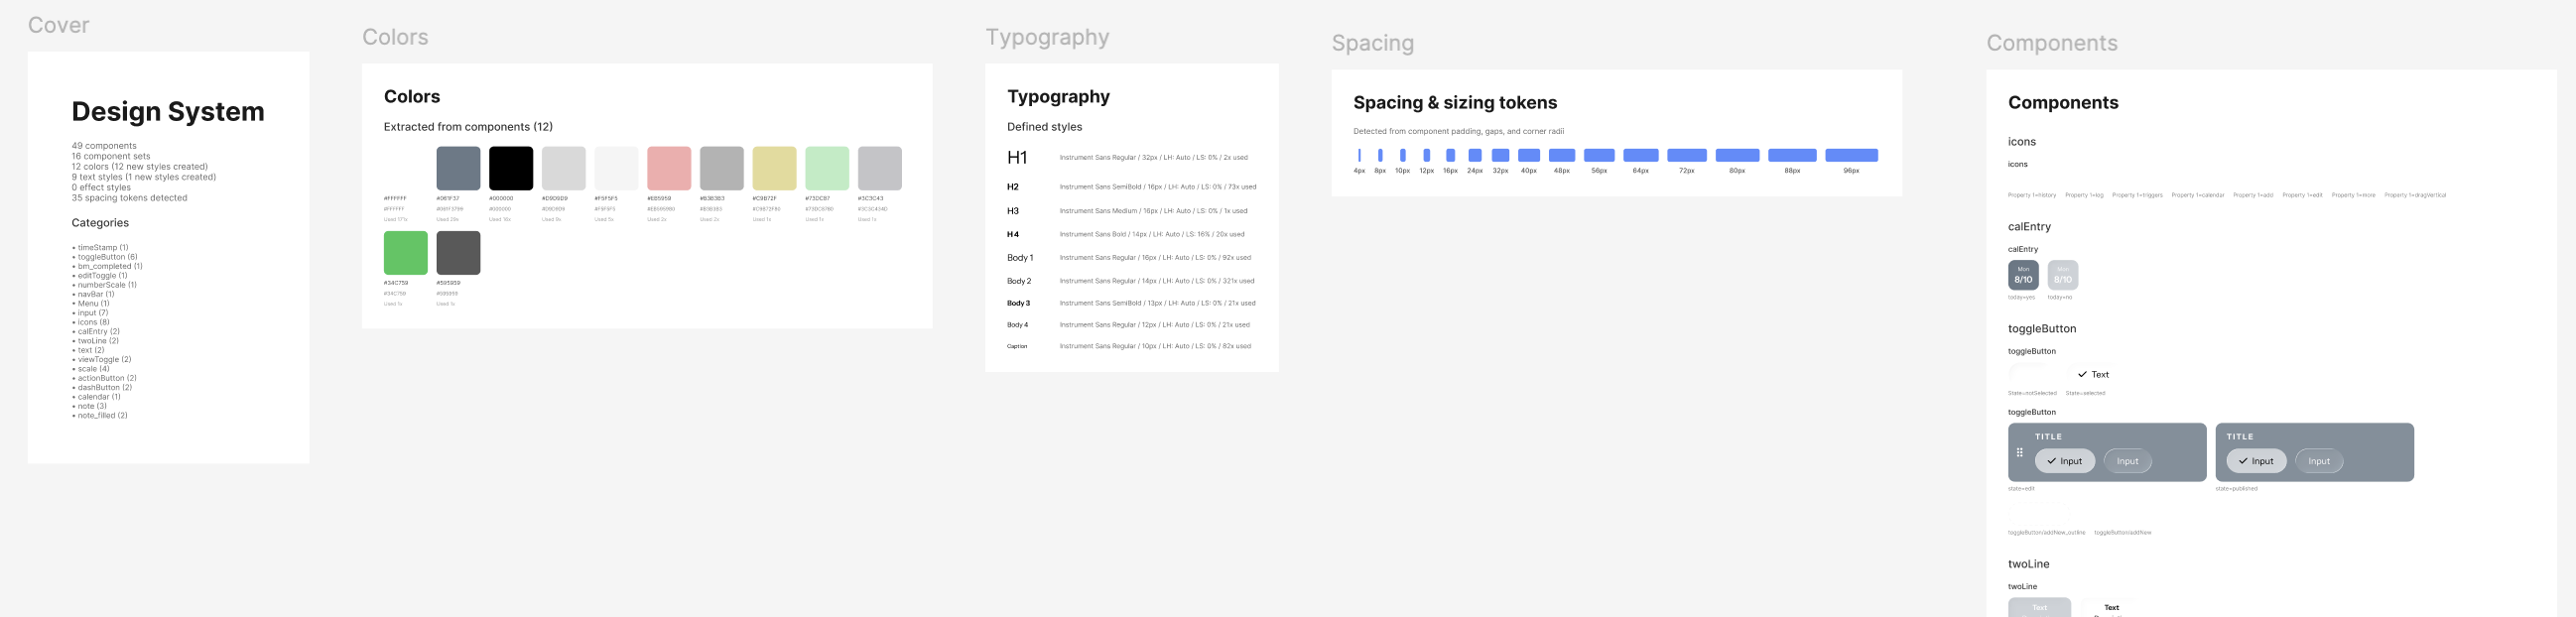
Once I had established the visual direction, I built out the core experience in Figma (I still prefer Figma for designing, although you'll see that later I used Claude to refine and build out interactions). I used Figma Agent to help generate a design system and add those variables into Figma. What previously would have taken several hours of manually configuring variables and building components could now be accomplished in seconds with AI assistance.
I also knew that one of my biggest goals was to make the app configurable from within the interface itself. That meant designing components that could accommodate new inputs and use cases without requiring new code every time.
To keep the system flexible without introducing unnecessary complexity, I narrowed the editable inputs down to three categories:
Toggle buttons: For binary inputs with on/off states, such as whether I'd taken a supplement or gone for a walk.
Scale components: For numeric or range-based inputs, such as pain and stress levels.
Custom components: For more complex interactions that didn't fit either pattern. I kept these non-editable because making them configurable would have introduced complexity without enough benefit.
This gave me a relatively small set of reusable building blocks that could support most of the tracking experience while keeping the app simple to maintain.
Design system and components, made with Figma Agent
Bringing the Experience Together
With the visual direction and core components established in Figma, I moved into Claude Design to flesh out the rest of the experience.
First, I took my Figma files and used them to recreate my design system in Claude Design. From there, I had Claude rebuild my design using my own design system.
I iterated within Claude to build out the Edit Mode functionality, which allowed me to see how changes to my tracking inputs would translate into the actual interface and interact with the rest of the app.
Finally, I designed the Analytics and AI Agent sections in Claude Design, extending the experience beyond daily data entry into a tool that could help me understand the information I was collecting.
The result was a shift in how I thought about the product: from a simple symptom log to a more flexible health-tracking experience, designed around both simplifying the experience of collecting personal data and making that data useful.
Click here to view and interact with the Claude artifact (Claude does not allow artifacts to be embedded).